
This is a data visualization project based off data collected by the Bigfoot Field Researchers Organization (BFRO) which is available for download here. This was group project completed by Ben Fisk, Jamie Lee, Yousef Farge, and myself. The goal of this project was to make a convincing data visualization using D3.js to explore Bigfoot sightings and allow the user to determine if the legend of Bigfoot holds any merit or is pure fiction.
The project consists of two primary connected elements: a trend plot (figure 1) and a map (figure 2). The trend plot shows three seperate lines for each class of observation and has interactive popups for historic Bigfoot-related events that may have influenced reported sightings and a brush that allows users to select a time range of reports to display on the map. The map has a single point for every reported sighting within the selected region on the trendplot. Clicking on a state shows more information about sighitngs within that state and a drop down menu allows the user to add a chloropleth scale to the map displaying one of several different statistics for each state.
You can view the site here.
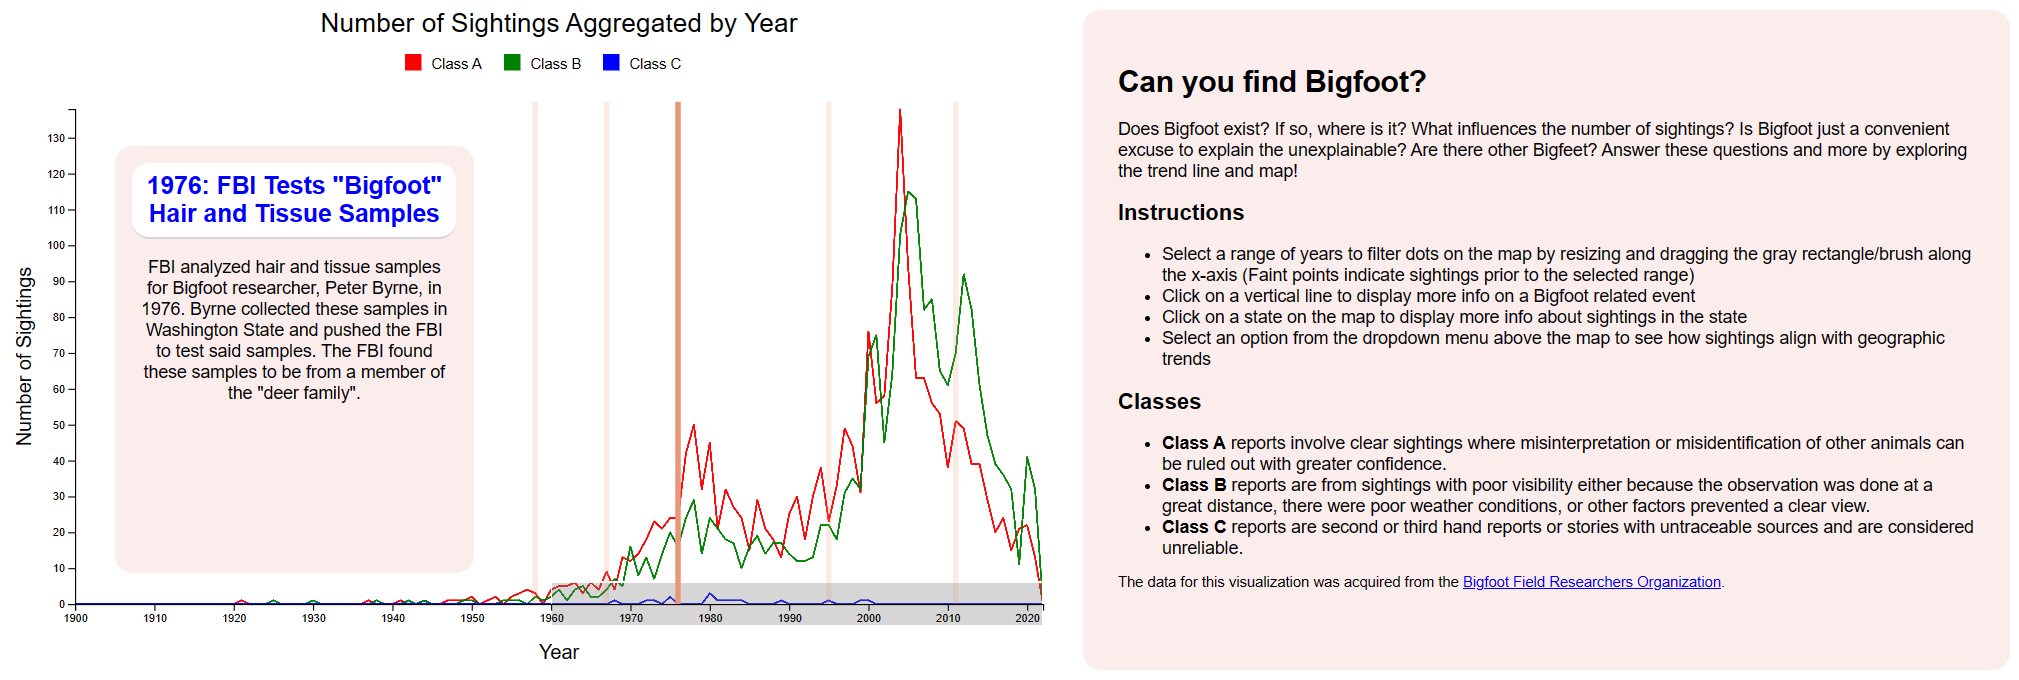 Figure 1: The trend plot with a popup and instructions.
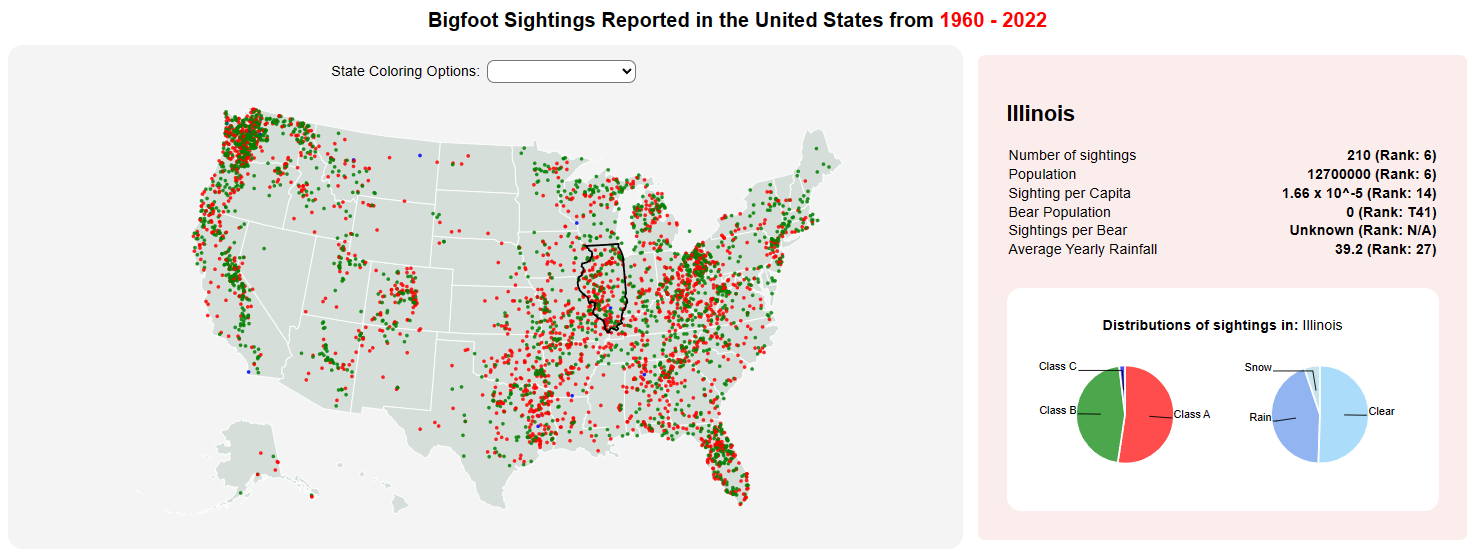 Figure 2: The map showcasing the sightings for the selected timeline and stats for Illinois.